언어설문조사와 자발화분석을 통해 본 한국어-영어 이중언어사용자의 언어능력평가
Assessment of Language Proficiency through Language Survey and Language Sample Analysis in Korean-English Bilinguals
Article information
Abstract
배경 및 목적:
언어사용에 대한 설문, 표준화검사, 자발화분석등을 통해 다언어아동과 성인의 언어능력을 예측하는 정보가 무엇인지 규명하고자 한다.
방법:
한국어-영어 이중언어 아동과 성인, 한국어 단일어 아동을 대상으로 언어설문조사, 두 개의 표준화검사, 자발화분석을 실시하였다. 영어 자발화는 Systematic Analysis of Language Transcripts를 이용하여 동일 연령의 영어모국어아동과 언어구사능력을 비교, 설문결과와의 상관관계를 조사하였다.
결과:
이중언어자는 메이즈(maze), 포기발화(abandoned utterance), 분당단어수(words per minute, WPM)에서 영어아동과 유의한 차이를 보였다. 아동의 경우 GFTA-2의 조음정확도와 EVT의 어휘능력, 자발화분석의 언어척도 중에는 비문발화수가 설문지에 보고된 아동의 영어능력과 상관이 있었다. 성인이중언어자의 경우는 자발화분석의 평균발화길이(mean length of utterance, MLU)만이 설문지에 보고된 영어능력과 상관있는 것으로 나타났다. 전반적으로, 어휘다양도(number of different words, NDW), 총발화어휘수(number of total words, NTW), MLU, 그리고 WPM이 높은 상관관계를 가진 것으로 나타났다.
논의 및 결론:
본 연구와 선행연구 결과를 종합하면, 다언어 아동 및 성인의 언어능력을 평가할 시, 언어설문이나 표준화검사뿐 아니라 자발화분석을 통해 최소한 NDW, NTW, MLU, 그리고 WPM을 측정해야 하는 것이 바람직하다고 보인다. 언어재활사가 다언어 아동 및 성인의 언어능력을 측정하기 위해 사용할 언어설문조사 또는 자발화분석 척도를 개발하는데 도움이 될 임상적 시사점에 대해 논의하였다.
Trans Abstract
Objectives:
The present study investigates which information obtained by three tasks—language survey, standardized tests, and language sample analysis (LSA)—best predicts language proficiency in children or adults from culturally and linguistically diverse (CLD) backgrounds.
Methods:
Korean-English bilingual children and adults were given a language survey and two standardized tests for articulatory accuracy and lexical abilities. Utterances for LSA were analyzed using the Systematic Analysis of Language Transcripts and compared to Korean monolinguals and English monolinguals (EMs).
Results:
The number of mazes, the number of abandoned utterances and words per minute (WPM) were significantly different from the age- and utterance-matched EMs. Perceived English proficiency in children was correlated with age of arrival, length of residence, performance on Goldman-Fristoe Test of Articulation-2 and Expressive Vocabulary Test, and the number of grammatical errors. Self-reported proficiency in adults was correlated only with mean length of utterance (MLU). The results also indicated that language measures, such as the number of total words (NTW) and the number of different words (NDW), MLU, and WPM, were closely related to one another.
Conclusion:
Based on the results of the present and previous studies, it is desirable for speech-language pathologists (SLPs) to evaluate at least NDW, NTW, MLU, and WPM from language samples when assessing individuals from CLD backgrounds. Clinical implications to help SLPs develop their own feasible yet reliable procedures for conducting language survey and LSA were discussed.
Interest in language assessment of bilinguals has increased along with an increase in minorities appearing on clinical caseloads. According to the US Census 2010, the number of children from culturally and linguistically diverse (CLD) backgrounds has increased dramatically to 24.9%, with Korean being the seventh most common non-English language spoken by 2% of the bilingual population. Similarly, the Korean government estimates the number of CLD children at approximately 150,000 in 2011 and expects to exceed 1.6 million by 2020 as the percentage of intercultural marriages in Korea has already reached 10.8% of the total marriages (Statistics Korea, 2010). Furthermore, 90% of Korean parents with children in first or second grade begin their child’s English education between the ages of 3 and 5 years as reported by Lee (2011). With these Korean-English bilingual (KEB) children in Korea as well as in other English-speaking communities, such as America, children who are exposed to more than one language will outnumber pure monolingual children in the near future.
Defining and classifying bilinguals are highly complex and influenced by multiple factors. Unfortunately, we have a long way to develop reliable, quantitative and qualitative assessments for identifying typical language development in linguistically diverse children (Brice, Carson, & O’Brien, 2009; Bullock, Toribio, González, & Dalola, 2006; Hammond, Mitchell, & Johnson, 2009; Holm & Dodd, 1999; Mennen, Stansfield, & Johnston, 2005). In many cases, assessing language proficiency begins with self-reported ratings on language survey because information on fluency of the target languages and linguistic backgrounds can be collected from numbers of bilinguals in a relatively short period of time. Therefore, measuring language learning outcomes in an L2 as well as assessing language development in young children (e.g., the Sequenced Language Scale for Infants) or children from CLD often takes the form of language survey. Some studies argue that parental- or self-reported language proficiency is not always reliable (Goldstein, Fabiano, & Washington, 2005; Goldstein & Washington, 2001), while others claim that language survey is good enough to predict behavioral language performance (Delgado, Guerrero, Goggin, & Ellis, 1999; Flege, MacKay, & Piske, 2002; Jia, Aaronson, & Wu, 2002; Marian, Blumenfeld, & Kaushanskaya, 2007). Education Testing Service (ETS) conducts large research activities on correlations between self-rated L2 English proficiency and various standardized English tests set by ETS. One of their research indicated that self-ratings on English proficiency were closely correlated with the scores of the Test of English for International Communication (TOEIC; Wilson, 1999). Marian et al. (2007) developed a reliable and valid questionnaire to measure language proficiency for bilinguals; their study showed that experience variables in the survey best predicted L1 proficiency while the age of arrival (AOA) best predicted L2 proficiency. They concluded that self-reported proficiency via their questionnaire, called the Language Experience and Proficiency Questionnaire (LEAP-Q), is valid for predicting language behavioral performance for many specific language domains, such as reading fluency, vocabulary size, oral and written comprehension, grammatical accuracy, etc. The common questions in the aforementioned studies include parental- or self-reported language proficiency in four language areas (i.e., speaking, listening, reading, and writing), age of exposure to L2, and the amount and places of language usage. The survey used in the present study also contained questions relating to these items.
Language sample analysis (LSA) is commonly recommended for informal assessments which provide a great deal of information on child’s receptive and expressive language abilities and articulatory accuracy in casual and natural speech. Therefore, many studies explored behavioral language performance and language proficiency in bilinguals by means of LSA (Bernardini & Schlyter, 2004; Genessee, Nicoladis, & Paradis, 1995; Yip & Matthews, 2006). The present study examined language proficiency as reported on a language survey and language abilities as measured by LSA in L2. The purpose of the present study is to examine the reliable indicators of self-reported or perceived language proficiency and to suggest survey questions and language measures in order to guide speech-language pathologists (SLPs) in developing their own efficient and time-saving assessment procedures for bilinguals. The method and results of the present study may contribute to our understanding of informal, qualitative language assessments and to predicting language proficiency for individuals from CLD backgrounds.
A vast majority of bilinguals clearly have a dominant or preferred language depending on external factors, such as language experience, age of acquisition, similarities and differences between the languages, the communicative needs, the attitude towards bilingualism, and even one’s personality (Grosjean, 1982). Therefore, it is important to consider varying degrees of bilingualism including bilinguals who speak an L2 with some difficulty and those who speak an L2 with equal proficiency in their first language (L1: De Houwer, 1999; Flege & MacKay, 2004; Genessee et al., 1995; Gildersleeve-Neumann, Kester, Davis, & Pena, 2008; Goldstein et al., 2005; Goldstein & Washington, 2001; Yeni-Komshian, Flege, & Liu, 2000). In general, simultaneous bilinguals who learn L2 before age 3 are more likely to achieve native-like proficiency in both languages than successive bilinguals who learn L2 after age 3 (De Houwer, 1999; McLaughlin, 1978; Oller, Kimbrough, Rebecca, Urbano, & Cobo-Lewis, 1997; Owens, 2005). Nevertheless, being a simultaneous bilingual does not guarantee that he or she speaks both languages with identical competence, and some of simultaneous bilingual children may in fact shift dominance to the majority language. Successive or sequential bilinguals who are born and raised in L1 and introduced to L2 later in life show greater individual differences in L2 proficiency.
Many studies suggested that proficiency in L2 is closely related to the age of acquisition of L2, which favors a ‘critical period’ hypothesis; however, the exact age range corresponding to the critical period has been controversial. In general, an individual who learned L2 between ages 7 and 15 may not reach native-like norm, with a negative correlation between the age of acquisition and performance (Johnson & Newport, 1989; Ploog, 1984; Yeni-Komshian et al., 2000). In Yeni-Komshian et al. (2000), KEBs who had arrived in the United States between the ages of 1 and 5 years produced English close to that of individuals who spoke English as an L1. Conversely, those who had arrived between the ages of 12 and 23 years spoke with a heavy foreign accent, showing great variability in L2 proficiency. The study of L2 proficiency is not limited only to a written or spoken language. Mayberry and Eichen (1991) examined the effect of age of acquisition on 49 users of American Sign Language (ASL). Three groups were comprised of 16 native signers who were exposed to and learned ASL from infancy, 20 childhood signers who were exposed to and learned ASL from the ages of 5 to 8 years, and 13 adolescence signers who were exposed to and learned ASL from ages of 9 to 13 years. Participants performed two tasks: a recall task of 8 long ASL sentences and a second recall task of 14 single-signed digits of ASL. Overall, recall accuracy was greater for native signers than childhood and adolescence signers. Native signers produced more instances of bound morphemes than childhood signers who, in turn, produced more instances than adolescence signers. Also, native signers performed better than childhood and adolescence signers at various linguistic levels of their responses to the sentence recall task, such as morphology, semantic paraphrasing, and syntactic grammaticality. Therefore, the results of this study confirm that the age of acquisition affects proficiency in a sign language also.
Nonetheless, some studies argue that the onset age of L2 acquisition is not sufficient evidence to support an advantage for youth or a critical period hypothesis and to predict one’s language proficiency (Abu-Rabia & Kehat, 2004; Bialystok & Miller, 1999; Birdsong, 1992; Flege, 1987). Other factors suggested as affecting one’s L2 fluency include the length of residence (LOR) in an L2-speaking community, the amount of L2 usage at home or at school, and the amount of exposure to L2. Several studies by Flege and his colleagues focused more on L2 learners’ experience with L2, such as the LOR, rather than the age of L2 acquisition alone, to better predict L2 proficiency. Flege and McKay (2004) compared perceptual performance on discrimination tasks of English vowel pairs by native Italian speakers who had lived in Canada for just 3 months to the performance by those who had lived in Canada for about 42 months. They also examined discrimination performance in bilinguals who were exposed to L2 English at early or later ages. The result of discrimination tasks on L2 English sounds demonstrated a substantial difference between native Italian speakers with a smaller LOR and native Italian speakers with a greater LOR. Nonetheless, no significant difference was found between early L2 learners and late L2 learners, suggesting the AOA alone cannot predict one’s L2 proficiency. While the average LORs of the child and adult participants in the present study are similar, their AOAs are different between the two groups.
Recent studies on bilingualism have focused on language dominance to assess language abilities, developmental patterns, or speech-language disorders (Gildersleeve-Neumann et al., 2008; Goldstein et al., 2005; Lim, Lincoln, Chan, & Onslow, 2008). In Goldstein et al. (2005), 15 Spanish-English bilingual children with a mean age of 5;2 (year;month) were examined for speech production of Spanish and English words. Participants were identified as belonging to one of the three groups: five predominantly Spanish-speaking children, five predominantly English-speaking children, and five children who spoke Spanish and English equally well. Then, their performance in speech production of Spanish and English was compared by group. Crosslinguistic effects were not statistically significant between balanced and Spanish dominant bilinguals or between balanced (BAL) and English-dominant (ED) bilinguals; however, some trends were found in the use of phonological processes. Balanced bilinguals produced Spanish stimuli with more instances of final voicing, but fewer instances of consonant cluster reduction and spirantization than Spanish dominant bilinguals. Balanced bilinguals produced English stimuli with more instances of final voicing and final consonant deletion, but fewer instances of consonant cluster reduction, fronting, and backing than English dominant bilinguals. The investigators attributed these observed trends among the groups to the degree of crosslinguistic effect, i.e., language dominance.
More recently, Gildersleeve-Neumann et al. (2008) investigated crosslinguistic effects among English monolinguals (EMs), predominantly English-speaking bilinguals, and balanced English-Spanish bilinguals. In their study, 13 children, ages between 3;1 and 3;10, produced 65 words as spoken responses to a picture naming task. Grouping of the participants was based on parents’ and teachers’ report on language exposure and usage, speech clinicians’ ratings, and assessment of spoken language. Overall, production accuracy for vowels was greater than for consonants (with 86% and 68% accuracy, respectively). While group differences were not statistically significant for overall or vowel accuracy, they were for consonant accuracy. EMs made significantly fewer consonant errors than English dominant bilinguals (with 78% and 71% accuracy, respectively) and balanced Spanish-English bilinguals (with 55% accuracy), but English dominant bilinguals performed similarly to balanced bilinguals. In sum, language dominance in bilinguals predicts production performance for consonants, but not for vowels. The two aforementioned previous studies suggest that language dominance in bilinguals affects linguistic performance in some ways. In addition, the influence of language dominance in Lim et al. (2008)’s study was statistically significant. Thirty Australian English-Mandarin bilinguals aged between 12 and 44 years, who stutter, were categorized into three groups: fifteen ED, four Mandarin-dominant, and eleven balanced bilinguals based on a self-report about language dominance and language sample. The results suggested that percent syllables stuttered and perceived stuttering severity were higher in less-dominant language in ED and Mandarin-dominant bilinguals but similar for both languages in balanced bilinguals.
The present study investigates the best indicators of language proficiency or language dominance from a language survey and language samples spoken by KEB children and adults compared to EM and Korean monolingual (KM) children. Parental or participant’s report alone is not sufficient to determine one’s language proficiency, or language dominance (Goldstein et al., 2005), and the standardized tests are biased toward mainstream English speakers (Dollaghan & Campbell, 1998). Therefore, the author is particularly interested in LSA regarding to the interpretation of findings and the relationships between language proficiency and language measures from LSA. LSA may provide critical information on language skills which are not available from a language survey or standardized tests. Research questions are as follow:
1) Which language measures in English utterance via LSA best represent the differences between KEB and EM/KM and between KEB children and adults, as well?
2) Would KEB children who were reported to speak English better than Korean exhibit better language skills in English than KEB children who were reported to speak Korean better than English? Also, would balanced KEB children perform similarly to or differently from English- and Korean-dominant KEB children?
3) Which information in a language survey, standardized tests, and language measures is closely related to self-reported or perceived language proficiency?
4) Which language measures are interdependent or correlated with one another in utterances by KEB children and adults?
Indeed, the need for normative data on bilingual children has been highlighted in recent years, so that individuals from CLD backgrounds will neither be over-diagnosed (as having speech-language disorders) nor under-diagnosed (as having low English proficiency; Iglesia, Miller, & Nockerts, 2009). Moreover, most of the extant bilingualism literature emphasizes the importance of ascertaining language dominance in bilinguals. Thus, describing the relation of bilingualism and language dominance should be an important contribution to the extant literature and to the understanding of typical language development in children who are exposed to more than one language. Clinical implications for the language assessment of bilinguals using a language survey, standardized tests, and LSA are discussed based on the results of the present study.
METHODS
Participants
Three experimental groups consisted of 1) nine KEB children between the ages of 8 and 13 years, 2) eight KEB adults aged 21 years or older, and 3) eighteen KM children between the ages of 8 and 13 years. All participants had normal hearing sensitivity and no emotional, psychological or neurological problems, as reported by the participants or by the participants’ parents. Parents of the participants were Koreans and spoke Korean as their first language. Bilingual participants had lived in the United States for at least 2 years, but KM participants had never lived in an English-speaking community at the time of participation. KEB children were identified as belonging to one of the three subgroups, depending on AOA, LOR, and qualitative consideration of the language survey. ED bilingual children were exposed to English prior to 3 years of age, with an LOR of at least 5 years and spoke English at a native level and more often than Korean. BAL children were exposed to English between the ages of 3 and 7 years, with an LOR of at least 3 years, and spoke both English and Korean at an intermediate level or higher. KD bilingual children were exposed to English at the age of 7 years or older, with an LOR of at least 2 years, and spoke Korean at a native level and more often than English. Each of these three subgroups of KEB children was composed of 3 participants.
Task procedure
All participants or their parents completed the language survey at the first meeting (Appendixes 1 and 2). Then, a language sample was collected in English. Language samples were transcribed by a research assistant whose native language is American English; and all tasks were conducted and analyzed by the author. To elicit the language sample, each bilingual participant was asked to talk about his or her favorite movies, books, or TV shows and to tell a story about them. The author encouraged participants to tell the story continuously with prompting responses or questions. Such samples provide words and sentences a participant says spontaneously in a naturalistic setting. The sample length was usually 5 or more minutes or 50 or more utterances (which is often argued to be desirable, see Miller & , 1981). Gavin and Giles (1996) have shown that the reliability of LSA was greater when the language measures were driven from utterance-based samples than time-based samples. Therefore, the language measures in the present study were derived from utterance-based units, i.e., the total number of utterances. KM participants were asked to answer basic questions typical of daily conversation, such as “what grade are you in”, “how old are you”, “how are you”, “what is your hobby”, and so on. Having an interview in English with the KM children proved very challenging and their samples were approximately 17 utterances or 2 minutes. Most of their responses were laughter, giggles, and the answer “I don’t know.” Language samples were recorded on a laptop computer (Satellite S205; Toshiba, Tokyo, Japan) with a headset microphone (Audio 350 ultimate performance headset; Plantronics, Santa Cruz, CA, USA) in a quiet lab room or in a quiet room at the participant’s home.
Measurements
The language survey
As discussed earlier, the survey designed in the present study includes the age of acquisition and L2 experience, which have been shown to be closely related to L2 proficiency. As for bilingual adults, prior linguistic experience before the arrival in the United States was collected, including formal language education for English, a visit to English-speaking communities, and contact with native English speakers. The survey also assessed language preference in several different environments—at home, at work or school, at social club, at church/chapel/temple (both for child and adult participants), at daycare, at play place, at after-school program (for child participants only), and other places. Participants were asked to indicate self-assessed language proficiency in both Korean and English in speaking, listening, writing, and reading skills. Their choices were numerically coded on four scales: 1 point for a beginner’s level, 2 points for an intermediate level, 3 points for an advanced level, and 4 points for a native level. As for a child participant, his or her parents should indicate perceived English and Korean proficiency of their child as well as their perceived English and Korean proficiency.
Standardized tests
All participants were given a speech and language evaluation, including standardized tests of English articulation, namely the Goldman-Fristoe Test of Articulation-2 (GFTA-2), and expressive English vocabulary, namely the Expressive Vocabulary Test (EVT). The GFTA-2 and EVT, designed for EMs with normative profiles, are reported here only to give a general idea of participants’ proficiency of spoken English. The EVT was not administered in a standard fashion since it was given to screen the bilingual participants for the present study. The EVT was administered up through to the age level but not higher; therefore, the participants could have earned higher standard scores than what had been reported. Nevertheless, the EVT did not appear to be a thorough enough assessment to measure vocabulary size or word retrieval ability in a bilingual population, given that there were a few word items that no bilingual adult knew. For example, one of the test items asks what the synonym is for the word ‘pig’, and all adult participants answered ‘pork’, which is counted as incorrect according to the EVT scoring procedures.
Language sample analysis
The English spontaneous language sample from a spoken interview was transcribed and analyzed using the Systematic Analysis of Language Transcripts (SALT) software, designed to analyze language samples and compare measures from a sample to a variety of control groups (Miller & Chapman, 1981). SALT allows comparison of various language measures to archived databases in the program, containing samples matched for child’s age and for the number of utterances in his or her sample. For example, if an input language sample is 63 utterances in length and is produced by a participant at 11 years of age, a profile database—automatically generated—is a collection of language samples which are all 63 utterances in length and produced by children who are aged between 10;6 and 11;6 (i.e., ±6 months of the target child’s age). Language measures of utterances by KEB adults were compared to the SALT profile data for 16 years old. At least 50 English utterances were collected from KEB children and KEB adults and at least 10 English utterances from KM children. Previous studies have shown that 50 utterances are long enough to provide powerful predictive evidence of oral language proficiency in monolingual children (Berman & Slobin, 1994; Craig & Washington, 2000; Miller, 1981; Snow, 1983). Kemp and Klee (1997) reported that the majority of SLPs typically collected 50 utterances from a child, 28% collected less than 50 utterances, and 24% collected more than 50 utterances. Further, Heilmann, Nockerts, and Miller (2010) investigated the relationship between the level of reliability and the sample length for LSA (1-, 3-, and 7-minute samples) and found that language measures are not significantly related to sample length. Therefore, 50 utterances were considered to be enough to serve the purposes of the present study and to examine English proficiency in each group. Further, SALT provided database files with which to compare various measures of 50 complete and intelligible (C&I) utterances among the participants.
The mean length of utterance (MLU) is often used to determine the stage of language development, which is defined as the statistical average of the numbers of words or morphemes per utterance (Dollaghan & Horner, 2011; Miller & Chapman, 1981; Rice, Redmond, & Hoffman, 2006; Templin, 1957). The automatic MLU calculation is known as the most accurate in measuring language ability among other automated language measures, such as Language Assessment, Remediation, and Screening Procedure (or LARSP), developmental sentence scoring, Index of Productive Syntax (Long & Channell, 2001), and so on. MLU also played a prominent role in assessing morphosyntactic development not only in children with language disorders (Hewitt, Hammer, Yont, & Tomblin, 2005; Klee, Schaffer, May, Membrino, & Mougey, 1989; Rice et al., 2006) but also in children from CLD background (Klee, Stoke, Wong, Fletcher, & Gavin, 2004; Paradis, Crago, Genesee, & Rice, 2003). Several research showed that MLU predicts bilinguals’ language proficiency with high reliability. Genessee et al. (1995) conducted LSA to assess language dominance or proficiency in early bilingual children; they argued that the assessment should include MLU, and number of different words. Yip and Matthews (2006) also argued that language proficiency in bilinguals can be measured by MLU. In the present study, MLU in words were calculated for all spoken utterances.
Another useful index of language ability is the number of different words (NDW) and the number of total words (NTW). NDW has been suggested as a reliable and valid index of measuring lexical abilities with strong internal consistency (Heilmann et al., 2010; Miller & Chapman, 1991; Miller & Klee, 1995; Tilstra & McMaster, 2007; Tomblin, Records, Buckwalter, Zhang, Smith, & O’Brien, 1997; Watkins, Kelly, Harbers, & Hollis, 1995). Therefore, NDW has been recommended as a means of identifying a language disorder and assessing semantic skills even for populations who do not speak mainstream American English (Craig & Washington, 2000; Goldstein & Washington, 2001; Heilmann et al., 2008). Further, measures, such as NDW and MLU, derived from language samples in a naturalistic setting were highly correlated with standardized tests, such as Peabody Picture Vocabulary Test-III and Clinical Evaluation of Language Fundamentals (Bornstein & Hay-nes, 1998; Condouris, Meyer, & Tager-Flusberg, 2003).
In addition to MLU, NDW, and NTW, speech rate in words per minute (WPM), the number of mazes, the number of grammatical errors, and the number of abandoned utterances were calculated. A measure of verbal fluency (i.e., WPM) has been proposed as an index of language proficiency for L2 learners (Heilmann et al., 2008, 2010; Riggenbach, 1991; Ryan, 2000; Wood, 2004). Mazes are portions of utterances that do not contribute to meaning, such as fillers (e.g., ‘um...’), revisions (e.g., ‘She go’ She goes shopping), and repetitions (e.g., Wendy went ‘out’ out of the church) within an utterance (Loban, 1976). For example, a maze is marked in the following sentence with parentheses: “(I um uh I want I want to go) I want to drive to the store.” Previous studies have argued that the frequency of mazes, which is sensitive to the linguistic demands, provides a reliable diagnosis for a child with language impairment (Leadholm & Miller, 1992); therefore, the measure can be a potential source of difference between monolingual children and children from CLD backgrounds with limited proficiency in a target language.
Utterances that dropped off before completion of a thought were coded as abandoned utterances, which were distinguished from mazes. If the discontinued utterance was not followed by a corrected utterance or never readdressed, it was classified as an abandoned utterance. For example, an abandoned utterance is marked in the following sentence with parentheses, “(I went fishing with ...) I hate to go out.” The number of grammatical errors and abandoned utterances—possibly due to the failure of completing grammatical sentences—was also included because these errors may result from L1 interference or from limited English proficiency (Clahsen & Muysken, 1986; DeKeyser, 1998; White, 1991). It is challenging for L2 adult learners to master L2 grammar because adults already have an internalized L1 grammar which interferes with acquiring and using L2. Therefore, these measures will allow us to see the relationships between the age of acquisition and English proficiency. All language measures mentioned above were subjected to two separate Multivariate Analysis of Variances (MANOVAs) for the three groups (i.e., KEB children, KEB adults, and KM children), and for the three subgroups of the KEB children (i.e., the ED, BAL, and KM groups). Results of these two MANOVAs would answer the first and the second research questions. As for the third and the fourth research questions, three Pearson product-moment correlations were conducted to see the reliability of self-reported or perceived language proficiency in comparison with information from a language survey, standardized tests, and language measures. Correlation will also show the relationships among the language measures.
RESULTS
Language survey and standardized tests
Table 1 summarizes the survey results for the KEB children, the KEB adults, and the KM children. The average chronological age of the 9 KEB children was 10;3 (SD=2;1), the average age of the 8KEB adults was 22;8 (SD=2;1), and the average age of the 18 KM children was 11;0 (SD=0;6). The AOA was 5;8 (SD=3;7) for the KEB children and 18;0 (SD=2;6) for the KEB adults. None of the KM children had lived in an English-speaking community. The LOR of the KEB children was 4;7 (SD=1;7) which is similar to that of KEB adults, 4;9 (SD=0;7). KEB children were reported to speak English as often as Korean at home but more often at school by their parents. KEB adults, most of who lived by themselves in the United States, answered that they speak only Korean when they are with their family members (over the phone) or their friends, even though they speak English more often than Korean at school. All curriculums in the schools that these bilinguals attended were taught in English only. All of the KM children spoke Korean only both at home and at school, although they received an hour-long class in English once a week at school. As for perceived language proficiency, some KEB children were reported by their parents to speak English better than Korean, while others, to speak Korean better than English. Adult participants or parents of child participants were asked to indicate English and Korean proficiency in four language domains, such as speaking, listening, writing, and reading. Self-reported or perceived proficiency was numerically coded: 1 for the beginners’ level, 2 for the intermediate level, 3 for the advanced level, and 4 for the native level. The average of perceived language proficiency in English was 2.78 (SD=0.36) for KEB children, 3.19 (SD=0.85) for KEB adults, and 1.28 (SD=0.41) for KM children. Overall, expressive language skills in English, such as speaking and writing, were perceived lower than receptive language skills in English, such as listening and reading, by the three groups. The average of the perceived language proficiency in Korean was 2.56 (SD=0.16) for KEB children. On the other hand, all KEB adults and KM children reported themselves as native Korean speakers (i.e., M=4, SD=0). Perceived language skills of speaking, listening, writing, and reading in Korean for the KEB child group are reported in the next section.
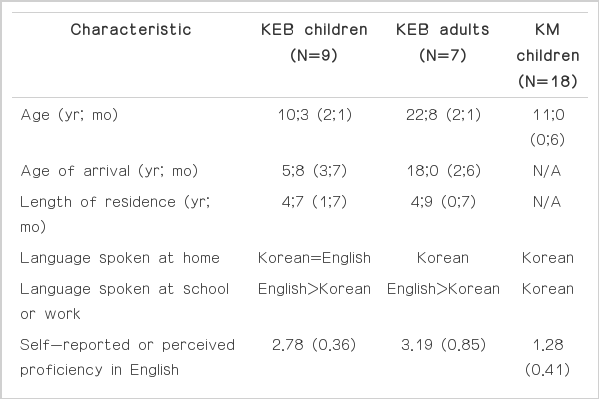
Characteristics of Korean-English bilingual (KEB) children, KEB adults, and Korean monolingual (KM) children
Raw error scores on the GFTA-2, i.e., the number of incorrect articulations, are presented, instead of standard scores. Raw scores are more informative and better fit the purposes of the present study, because even a small number of articulation errors results in a dramatic drop in the standard score. The average number of incorrect articulations was smaller in the KEB child group (M=3.1, SD=2.2) than in the KEB adult group (M=6.3, SD=1.6), and the KM child group (M=13.9, SD=5.5). The most frequent errors were for production of the consonant /ʤ/ and the coda consonant /z/ in KEB children, the consonants /θ, ð, ʤ/ and the coda consonant /z/ in KEB adults, and the consonants /v, θ, ð, z, ʧ, ʤ/ in KM children. The values reported for the EVT in Table 1 are standard scores, with a mean of 100 and a standard deviation of 15. The average standard score of KEB children (M=80, SD=10) was lower than that of KEB adults (M=96, SD=12), but higher than that of KM children (M=60, SD=7). Based on the observation of the survey and examination of the GFTA-2 and EVT, it appears that the KEB children—who were exposed to English earlier than the KEB adults but for a similar LOR (LOR was approximately 4½ to 5 years)—produced English sounds more accurately, but had a smaller vocabulary size than the KEB adults (recall, though, that because KEB children were not administered vocabulary items above their age range, their scores may under-represent their true vocabulary abilities).
Table 2 is a summary of the results from the language survey for the three subgroups of the KEB children, i.e., the ED, BAL, and KD groups. The average chronological age of the ED group was 8;4 (SD=0;5), the average age of the BAL group was 9;8 (SD=1;6), and the average age of the KM group was 12;7 (SD=0;7). AOA was earlier in the ED and BAL groups (M=3;0, SD=1;0 and M=4;0, SD=2;0, respectively) than the KD group (M=10;0, SD=1;0). LOR was also longer in the ED and BAL groups (M=5;6, SD=0;3 and M=5;9, SD=0;2) than the KD group (M=2;7, SD=0;10). At home, children in the ED group spoke English more frequently than Korean, children in the BAL group spoke English as often as Korean, and children in the KD group spoke Korean more frequently than English. At school, all children spoke English more frequently than Korean. As perceived by their parents, the ED group was reported to speak English fluently at a native level (i.e., 4 out of 4), and the KD group was reported to speak Korean fluently at a native level (i.e., 4 out of 4). On average, the perceived language proficiency in English was 3.67 (SD=.58) out of 4 for the BAL group but 2.25 (SD=.43) for the KD group. The average of perceived language proficiency in Korean was 1.42 (SD=.14) for the ED group and 2.25 (SD=.43) for the BAL group. Parents of the child participants were also asked to evaluate their perceived language proficiency in English. Fathers of the ED and BAL group spoke English at an advanced level (M=3, SD=.25 and M=3, SD=0, respectively), while fathers of the KD group spoke English less fluently at an intermediate level (M=2.33, SD=.058). The average perceived language proficiency in English of the participants’ mothers was 1.75 (SD=0) for the ED group, 2.25 (SD=.66) for the BAL group, and 1.92 (SD =.14) for the KM group. The average number of incorrect articulation of English words via GFTA-2 was 2 for the ED group, 2.3 for the BAL group, and 5 for the KD group. The raw scores of EVT revealed that the ED group (M=86, SD=7.2) performed similarly with the BAL group (M=86, SD=7.7) but better than the KD group (M=69, SD=3).
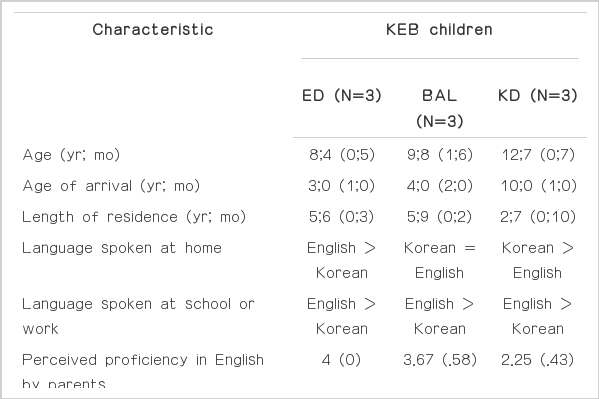
Characteristics of three proficiency subgroups in Korean-English bilingual (KEB) children
Language sample analyses
Comparisons of the three child and adult groups
Various measures from LAS in KEB children, KEB adults, and KM children and the related statistical analysis are presented in Table 3. The average number of C&I utterances was 63 for KEB children, 61 for KEB adults, and only 17 for KM children. The MANOVA showed that the average number of C&I utterances was significantly different among the three groups, F2, 31=10.971, p=.000, with a large effect size ηp2=.888, and power p=1.000. The oral interview in English was typically short with KM children, because they barely spoke English and also appeared to feel uncomfortable with having a conversation in English. According to the results of the MANOVA, NDWs and NTWs were significantly different among the groups (F2, 31=143.604, p=.000, ηp2=.911, and p=1.000; F2, 31=104.445, p=.000, ηp2=.882, and p=1.000, respectively). Comparison of NDW and NTW for the KEB children (M=117, SD=12 and M=274, SD=55, respectively) with those for the KM children (M=17, SD=8 and M=30, SD=13, respectively) revealed great differences in English proficiency. If KEB children produced 17 C & I utterances, their NDW and NTW are expected to be 32 and 74 on average according to the SALT database, which are still greater than NDW and NTW of KM children. The number of ungrammatical utterances was manually tallied without using SALT and reported by counting incorrect word-order, missing elements, unnecessary elements, or incorrect word-inflections. The MANOVA showed a significant group difference for the number of ungrammatical utterances, F2, 31=18.222, p=.000, ηp2=.713, and p=1.000.

English language sample analyses and multivariate analysis of variance for three age-language status groups
The average MLU in words was 5.3 (SD=1.5) for KEB children, 6.4 (SD=1.3) for KEB adults, and 1.5 (SD=0.3) for KM children. The MANOVA showed a significant group difference for MLUw among the three groups, F2, 31=69.187, p=.000, ηp2=.832, and p= 1.000. Standard deviations from the utterance- and age-matched normative means for EM children in the SALT database suggest that the averaged MLUs in KEB children and adults were not substantially different from those in SALT profile groupas indicated by standard deviation from the normative means (henceforth, sd; sd=.02 and sd=.72, respectively). The average MLU in KM children, however, was substantially lower than the MLU in the SALT profile group (sd=-2.34). The MANOVA showed that ‘sd’ differences were also significant among the three groups, F2, 31=37.628, p=.000, ηp2=.729, and p=1.000. WPM was calculated by dividing the total number of completed words by the elapsed time. The average WPM was similar for KEB children (M=75, sd=27) and adults (M=72, sd=23), but lowest for KM children (M=18, SD=4). Differences in WPM among the three groups were statistically significant, F2, 31=38.840, p=.000, ηp2=.902, and p=1.000. The average standard deviation from the normative means suggest that the speech rate of KEB children (sd=-.74) is slightly but not substantially slower than that of EM children in the SALT profile group. On the other hand, the speech rates of KEB adults and KM children were substantially slower than those of the age-matched profile group (sd=-1.25 and sd=-2.16, respectively). The average ‘sd’ was also significantly different among the groups, F2, 31=16.174, p=.000, ηp2=.536, and p=.999.
The MANOVA showed a significant group difference for the number of mazes among the three groups, F2, 31=12.958, p=.000, ηp2=.481, and p=.994. Contrary to what might be expected, however, KEB children (M=27, SD=22) and adults (M=18, SD=6) produced more mazes than KM children (M=3, SD=2). Differences from the normative mean in the SALT profile group were substantially higher in KEB children (sd=1.09) than KEB adults and KM children (sd=0.24 and sd=-.36, respectively). The average standard deviation for the number of mazes did not show a significant group differences, F2, 31=2.114, p=.140, ηp2=.131, and p=.397. The MANOVA indicated that the number of abandoned utterances was significantly different among the groups, F2, 31= 17.258, p=.000, ηp2=.552, and p=.999. Compared to EM children in the SALT profile group, KEB children (sd=2.14) and adults (sd=1.72) produced abandoned utterances substantially more often than the profile group. The average standard deviation of the number of abandoned utterances was subject verb agreement also significantly different among the groups, F2, 31=12.488, p=.000, ηp2=.471, and p=.992.
According to Scheffe post hoc tests to follow-up the MANOVA, even though the group difference was not significant between KEB children and adults, it was significant between KEB children and KM children as well as between KEB adults and KM children for all measures that were statistically significant.KEB children and adults produced more C&I utterances and their NDW and NTW were much greater than KM children. A follow-up Scheffe test also indicated that KEB children and adults produced longer phrases or sentences per utterance and spoke English much faster than KM children. Interestingly, however, KEB children and adults produced mazes, ungrammatical and abandoned phrases or sentences more often than KM children. The smaller number of utterances in the language samples may have resulted in the smaller number of grammatical errors of abandoned utterances for KM children.
Comparisons of the three subgroups of the bilingual children
Descriptive and inferential statistics of the results from LSA for the three subgroups of the KEB child groups are presented in Table 4. Overall, the BAL group seemed to perform better than the other two groups. Although no significant differences were found for any measures among the three subgroups, some trends were found. Three measures of C&I utterances, NDW, and NTW were highest in the BAL group (M=67, SD=1; M=124, SD=10; and M=302, SD=54, respectively); but the number of grammatical errors, however, was highest in the KD groups (M=9.7, SD=3.5), compared to other two groups. The MLU of the BAL group (M=6.1, SD=1.2) was also highest among the subgroups and its SD from the normative means, or sd to differentiate from SD (sd=.4) also indicates that the BAL group produced slightly longer phrases or sentences per utterance but the ED and KD groups produced slightly shorter phrases or sentences per utterance (sd=-.2 and sd=-.03) than EMs in the SALT database. WPM indicates that the BAL group spoke English the fastest among the three groups and their differences of WPM from the SALT profile group (sd=-.2) were the smallest among the three groups. The number of mazes for the KD group (M=30, SD=25) was the greatest among the three subgroups and was substantially lower than for the profile group (sd =2.54). The BAL group (M=8.7, SD=6.7) produced more instances of abandoned utterances than the other two groups. The numbers of abandoned utterances for all three subgroups were substantially greater than for the profile group (sd=1.3 for the ED group, sd=3.0 for the BAL group, and sd=2.1 for the KD group).

English language sample analyses for three proficiency subgroups of KEB children
Correlation analyses in Korean-English bilingual children and adults
To answer the question which information from three tasks—a language survey, standardized tests, and language samples—best predicts bilinguals’ English proficiency, three Pearson correlations were conducted for the KEB children and adults. Table 5 is a display of significant correlations between perceived proficiency in English and related evaluation. Perceived English proficiency in KEB children was negatively correlated with AOA but positively correlated with LOR; that is, the earlier the child emigrated to the United States and the longer the child lived in the United States, then the higher the proficiency level was (r=-.645, p=.009 and r=.555, p=.032, respectively). GFTA-2 and EVT turned out to be significantly correlated with the perceived proficiency (r=-.839, p=.005 and r=.663, p=.050, respectively); that is, KEB children with higher English proficiency made less articulatory errors and had greater lexical abilities than KEB children with lower English proficiency. Among various language measures, only the number of grammatical errors revealed a significant correlation with the perceived English proficiency (r=-.663, p=.007). Bilingual children whose perceived proficiency was higher, as in the ED group, made more grammatical errors than children whose perceived proficiency was poorer, as in the KD group. As for KEB adults, self-reported proficiency in English was correlated only with MLUw (r=.913, p=.011), where MLUw is longer in bilingual adults with higher English proficiency than the adults with lower English proficiency.

Correlations between perceived proficiency in English and language measures
Correlations among the language measures were also examined as seen in Tables 6 and 7. The statistical analysis in KEB children revealed strongly positive correlations between NDW and WPM (r=.897, p=.001), between NDW and WPM (r=.869, p=.002), and between MLUw and WPM (r=.796, p=.010). The number of mazes was also strongly correlated with the number of grammatical errors (r=.732, p=.025) and with MLUw (r=.762, p=.017). The Pearson correlations suggested correlation patterns for KEB adults different from those for KEB children. Strong positive correlations were found between C&I utterance and WPM (r=.892, p=.017), between NDW and NTW (r=.972, p=.001), between NDW and MLUw (r=.889, p=.018), and between NTW and MLUw (r=.927, p=.008). A correlation between the number of mazes and the number of grammatical errors (r=-.828, p=.042), however, was negative, unlike in KEB children.
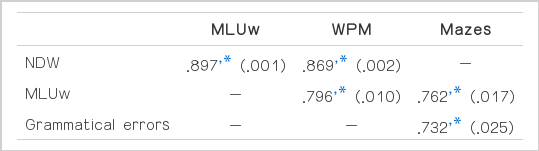
Correlations among language measures in Korean-English bilingual children
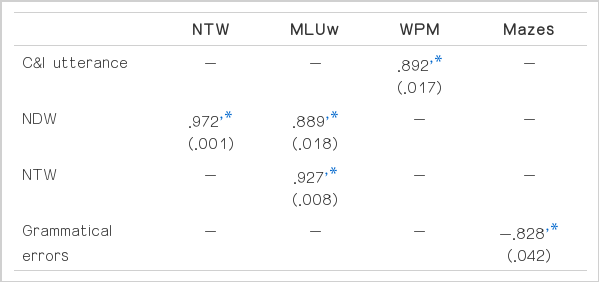
Correlations among language measures in Korean-English bilingual adults
CONCLUSION
Summary of the results and conclusions
The first research question asked which information from three tasks—language survey, standardized tests, and LSA—best predicts English proficiency compared to EM in the SALT database and KM children who participated in the present study. In addition, it also asked whether KEB children would exhibit better English proficiency than KEB adults. Evaluation of language survey informed that KEB adults and KM children spoke Korean only at home with their family members (Table 1). Articulatory accuracy as measured by GFTA-2 in KEB adults was higher than in KM children but lower than in KEB children. Performance on EVT was the highest in KEB adults and the lowest in KM children. According to the results from LSA of the present study, KEB children produced mazes and abandoned utterances significantly more often than the EM profile group in SALT (Table 3). KEB adults produced more instances of abandoned utterances and spoke English at a slower speech rate than the EM profile group. Nonetheless, comparisons with KM children implies that the frequencies of mazes and abandoned utterances do not necessarily reflect English proficiency for all cases because KM children produced less instances of mazes and abandoned utterances than the EM group. Second, Scheffe post hoc test following up the MANOVA showed no group difference between KEB children and adults; that is, none of the language measures in the present study was significantly different between KEB children (i.e., younger L2 learners) and KEB adults (i.e., older L2 learners).As mentioned previously, it can be concluded that the AOA alone does not predict L2 proficiency. The answer to the third question may exhibit indications that better predict self-reported L2 proficiency in adult participants.
The second research question asked whether the ED group of KEB children exhibits better command of English language evaluated by articulatory accuracy, lexical abilities, morpho-syntactic skills, and semantic skills, than the KD group of KEB children, and whether the BAL group of KEB children performs similarly to or differently from the ED and KD groups (Tables 2 and 4). Unfortunately, no language measures revealed significant group differences among the three subgroups of KEB children. Some trends, however, were observed. The number of grammatical errors was the greatest in the KD group and the lowest in the ED group. Overall, the BAL group performed better for many different measures, such as the number of C&I utterances, NDW, NTW, the number of MLUw, and WPM, than the ED and KD groups. These results imply that similar proficiency in both languages may not affect L2 proficiency negatively. Although children in the BAL group is one or more years older than children in the ED group, comparisons of MLUw with the age-matched profile group in SALT still reveals that the BAL group performed similarly to or very slightly better than their age-matched EM children, while the ED group performed similarly to or very slightly poorer than their age-matched EM children. Interestingly, the BAL group gave the author the impression that they possess greater lexical diversity in English as well as in Korean than the ED and KD groups when having a conversation with the author before or after the experimental sessions. As the fathers or mothers of all child participants were enrolled in masters’ or doctoral program in the United States, educational level of their parents does not explain such perceived differences. A future research may explore whether balanced bilinguals perform better than bilinguals with one prominently do minant language, and why it is, if so.
The third research question asked which survey questions, which standardized tests, and which language measures are closely related to self-reported or perceived language proficiency. The results from Pearson correlation indicated that AOA and LOR—information in the language survey—are moderately correlated with perceived English proficiency in children by their parents (Table 5). Performance on GFTA-2 and EVT revealed strong correlations with English proficiency perceived by their parents, where the ED group produced less speech errors and had better lexical abilities than the other two groups. The only language measure correlated with perceived language dominance in child bilinguals was the number of grammatical errors, where the ED group made less grammatical errors than the BAL and KD groups. Self-reported proficiency in KEB adults was not correlated with any information in language survey and standardized tests. Only the MLUw among other language measures has a significant correlation with self-reported proficiency.
The fourth research question asked which language measures are correlated with one another: in other words, which measures are internally consistent. LSA of utterances by KEB children showed that NDW is positively correlated with MLUw and WPM; MLUw is positively correlated with WPM and the number of mazes, and the number of grammatical errors is positively correlated with the number of mazes (Table 6). Different relations, however, were observed in KEB adults (Table 7). C&I utterance is positively correlated with WPM; NDW is positively correlated with NTW and MLUw; NTW is positively correlated with MLUw; but the number of grammatical errors is negatively correlated with the number of mazes. Correlations among the language measures in KEB children and adults are shown in Figures 1 and 2.

Correlations among the language measures in Korean-English bilingual children. The arrow indicates a significant correlation and the symbol "+" indicates a positive correlation. NDW=number of different words; MLUw= mean length of utterance in words; WPM=words per minute.
Correlations among the language measures in Korean-English bilingual adults. The arrow indicates a significant correlation. The symbol "+" indicates a positive correlation, whereas the symbol "-" indicates a negative correlation. NDW=number of different words, MLUw=mean length of utterance in words, NTW=number of total words, WPM=words per minute, C&I=complete & intelligible.
Clinical implications
Number of different and total words, mean length of utterance, and words per minute
Tilstra and McMaster (2007) demonstrated that NTW and NDW were the most reliable measures of verbal fluency when using samples as short as 1- to 2-minutes of narration. Heilmann et al. (2008) analyzed approximately 4-minute long language samples spoken by English-Spanish bilingual children and found that NTW, NDW, MLU, and WPM were the most useful language measures to evaluate L2 English proficiency. In Heilmann et al. (2010), the number of total utterances (i.e., C&I utterances in the present study), NDW and WPM were suggested to be the strongest reliable language measures. Although language measures of NDW, NTW, MLU, and WPM did not predict language dominance in KEB children as perceived by their parents, MLUw was strongly and positively correlated with self-reported language proficiency in KEB adults. Further, correlations among the language measures reveled close relations among NDW, NTW, MLUw, and WPM. Altogether, results of the present study and the previous studies suggest that SLPs should measure at least NDW, MLU, and WPM when assessing children or adults from CLD backgrounds. It is worth noting that late L2 learners or adult bilinguals were observed to have different characteristics with respect to language measures as shown in the present study.
Mazes, abandoned utterances, and grammatical errors
The number of mazes and abandoned utterances was significantly larger in KEB children compared to the age- and utterance length-matched EM group in SALT. Among KEB children, the number of mazes was significantly larger in the KD group of KEB children (i.e., those who speak Korean more dominantly than English) than the ED and BAL groups. Some researchers have argued that the frequency of mazes provides a reliable diagnosis for a child with language impairments as well as for a child from a CLD background (Leadholm & Miller, 1992). Others, however, have argued that an increase in mazes does not necessarily reflect disfluency (Starkweather, 1987); rather, the number of mazes can increase when delivering complex and abstract thoughts or when speakers are attempting to correct themselves (Leadholm & Miller, 1992; Levelt, 1989). The smallest number of mazes observed in KM children can be explained by this view that simple content of thoughts delivered by these children attributed to the smaller number of mazes in their utterances. The number of abandoned utterances was the greatest in the BAL group but the lowest in the ED group. The number of grammatical errors was greater in KEB adults than in KEB children and KM children. In sum, these results imply that mazes and abandoned utterances can be used as reliable indexes for assessment of L2 proficiency only when the length of utterance is long enough and the speaker’s L2 proficiency is good enough to deliver complex thoughts. Therefore, the number of mazes and abandoned utterances may not be necessarily evaluated when assessing language proficiency of children or adults from CLD backgrounds with poor language proficiency in the target language. Three Pearson correlations suggest that the number of mazes is closely related to the number of grammatical errors. Interestingly, KEB children show positive correlations between the two measures, while KEB adults show negative correlations between the two measures. Qualitative and thorough analyses of the relations between mazes and grammatical errors are required for future studies. Such studies may also explain different characteristics in second language acquisition between child and adult L2 learners.
Self-reported or perceived language proficiency
The results of the present study suggest that in order to predict one’s language dominance in child bilinguals, not only AOA but also LOR should be collected through a language survey. Perceived language proficiency in KEB children by their parents was positively correlated with LOR, and lexical abilities via EVT but negatively correlated with AOA, articulatory accuracy via GFTA-2 and the number of grammatical errors via LSA; that is, a child who had moved to the United States at an earlier age and has lived there for longer period was reported to speak English more dominantly than Korean as reported by his or her parents. These children in the ED group produced less speech and grammatical errors and possess better lexical abilities and better morpho-syntactic skills. Self-reported language proficiency in KEB adults, however, showed no predictable indicators from the language survey or standardized tests. The only predictable indicator of self-reported proficiency was the language measure, MLU. Some researchers have argued that L2 proficiency in adult learners is more susceptible to non-linguistic variances, such as motivation, affective factors, sociolinguistic factors, individual differences in one’s characters and in language learning abilities (Bialystok & Hakuta, 1994; Flege, 1987; Yeni-Komshian et al., 2000). Therefore, it is not desirable for SLPs to assess language proficiency of adult learners by relying only on a language survey or standardized tests. To obtain valid language assessment, SLPs should perform LSA by no means. Otherwise, future studies may focus on developing a language survey for adult L2 learners to predict L2 proficiency so to guide speech-language interventions for this population.
Comprehensive LSA is considered as an important part of the assessment process due to its many advantages. For example, LSA supplements limitations of norm-referenced tests as it allows clinicians to collect information on specific, interested language skills which are not available from standardized tests. It also allows SLPs to examine the communication skills of a child in a natural communication setting and to measure different aspects of language. Further, it has renowned specificity and reliability in identifying children with language impairments (Aram, Morris, & Hall, 1993). Despite its many advantages, many clinicians are reluctant to conduct LSA as a routine assessment, possibly for the following reasons. SLPs may not gain target linguistic skills or phonemic inventories because utterances in language samples are often non-structured, and they may not find available reference data to determine the developmental status or severity. Furthermore, conducting LSA requires detailed knowledge of grammar to make consistent and precise interpretation. Most of all, it is a difficult and time-consuming process (Kemp & Klee, 1997). Therefore, understanding which language measures from language samples are most critical and reliable will save time and effort in conducting LSA, which, in turn, may facilitate its use of a routine test in clinical caseloads. There are a few norm-referenced tests to assess speech and language development in bilingual population; thus, most clinicians have to depend on non-standardized, criterion-referenced tests. LSA, one of such assessment procedures, is known to be less vulnerable to cultural and linguistic variations than other informal language assessments (Heilmann et al., 2008; Stockman, 1996). The goal of the present study is not to provide definitive survey questions or language measures to predict language proficiency of bilinguals. Rather, the present study intends to help SLPs develop their own expeditious, feasible, yet reliable procedures of conducting a language survey and LSA when assessing language proficiency and predicting prognosis of the interventions for children and adults from CLD backgrounds. The increasing number of children and adults from CLD backgrounds worldwide demands SLPs to assume expanded roles, support bilinguals for their speech-language development, and provide better speech-language interventions for them.
References
Appendix
Appendix 1. Family Language Preference Survey for a Child Participant


Appendix 2. Language Preference Survey for an Adult Participant


